What are Viscosity Flow Curves?
A flow curve – also known as a rheogram – is a graphical representation of how a flowing material (fluid) behaves when it is subjected to increasing or decreasing shear rates. The corresponding shear stress and viscosity are calculated from the instrument’s parameters. You can tell what type of fluid (Newtonian/Non-Newtonian, thixotropic, dilatant, etc.) the sample is by the shape of the flow curve.
It is essential to know the fluid type and understand the flow curve so that you can make sure your product will be suited to its applications. For example, say that you have toothpaste that you need to pump through a tube. You’ll need to make sure that the toothpaste is shear thinning. That is, the force required to pump the toothpaste through the tube will make the fluid less viscous, and therefore it will flow more easily through the tube.
Creating a flow curve involves testing a sample over a range of shear rates. It’s most useful to make the testing parameters relative to how the sample will be processed in manufacturing or how the consumer will use it.
How to Create a Flow Curve:
- Decide what you want to test.
- Determine your testing parameters.
- Prepare a chart to document the test results.
- Program and run the test, recording the results in your chart.
- Create a graph based on the results in the chart.
Here’s an example:
(1) Let’s say you make toothpaste and you want to make sure it will flow easily when the user squeezes the tube, but won’t leak out when the tube is not being squeezed.
(2) You decide that you want to test your product at room temperature, starting at 0 rpm and gradually ramping up the speed. At a certain point, you will gradually lower the speed back to zero.
(3) You create an Excel spreadsheet to log the viscosity and shear rate (rpm) results.
(4) Program and run the test, recording your results every time the speed ramps up, and again when it ramps down.
(5) Use Excel to create a graph from your chart.
Common Terms Associated with Flow Curves: Yield Stress and Zero Shear Viscosity – What Do They Mean?
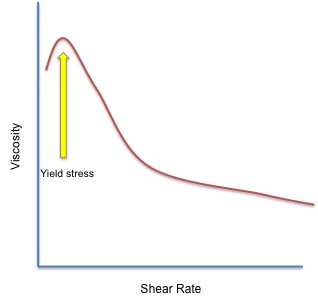
Yield Stress is the force needed to initiate flow of fluids that do not flow when they are stationary. This type of fluid is called “plastic”. You can see yield stress in your testing if the viscosity of your product increases as the shear rate decreases to zero.
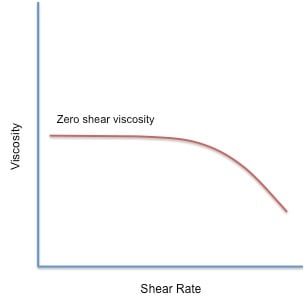
Zero Shear Viscosity is a term for non-plastic fluids. With this term, the viscosity of the fluid will plateau as the shear rate decreases to zero. This indicates that the fluid flows like a liquid when stationary.
Got questions about flow curves? Know of any good resources that explain this concept? Leave us a comment below!
Until next time,
Amanda
P.S. Be the first to know when we post a new blog article by subscribing at the top of the page!