As followers of these rants know, we manufacture and distribute tensiometers. As a
tensiometer manufacturer, we are often asked, “if I am going to replace my tensiometer, which one should I get?”
Let's explore the alternatives and compare their respective capabilities.
Topics:
Wilhelmy Plates,
Automatic Digital Tensiometer,
duNouy Rings,
Tensiometer,
Surface Tension Measurement,
Surface Tension,
Fisher Tensiomat,
Tensiomat Trade-In,
Liquid Properties,
Digital tensiometer,
automatic Tensiometer
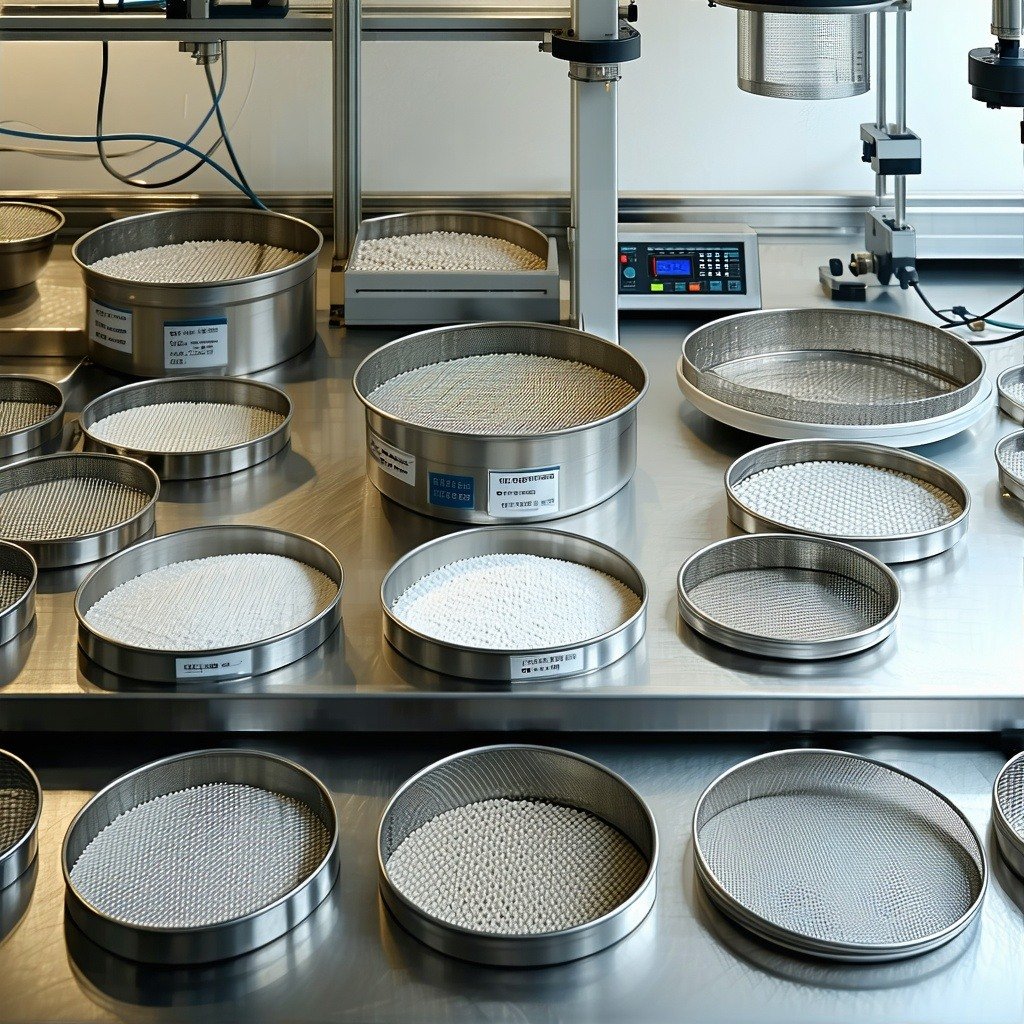
The Need for Mid-Point Sieves
ASTM and ISO establish standards for the acceptable range of openings in a wire mesh sieve. For larger mesh sizes, the variation between the largest and smallest acceptable openings has little impact on sieve performance. However, as mesh sizes decrease, the potential for performance differences between sieves becomes significant. These discrepancies, especially when an old sieve is replaced in a master stack, can lead to problematic QC data. Mid-Point sieves can help alleviate this issue.
What is a Mid-Point Sieve?
A mid-point sieve has had the mesh inspected after mounting. The sieve is then selected as a mid-point if the results give tolerances that are in the middle of the ASTM standard.
Read More
Topics:
Sieve Certification,
Sieving Process,
Sieve Analysis,
Sieve Quality
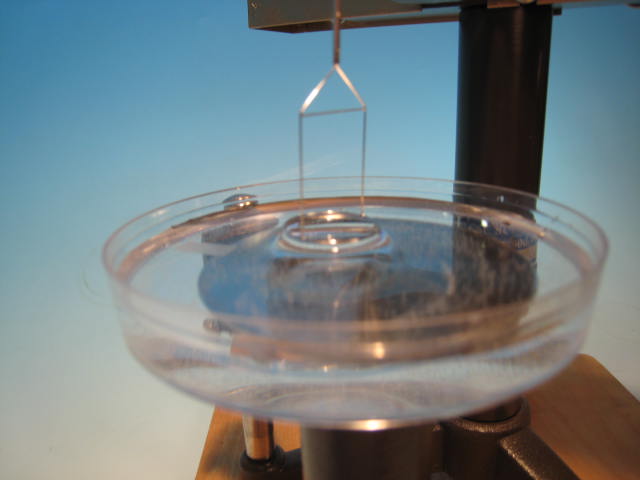
Discover the significance of platinum in du Nouy Tensiometer Rings and its impact on accurate surface tension measurements.
Read More
Topics:
duNouy Rings,
Surface Tension,
interfacial surface tension,
tensiometers,
du Nouy tensiometer,
water content measurement,
walk on water,
segmentation

Regularly I’m asked the question; “How accurate is this moisture balance?”
The questioner asks for the answer in terms of percent (%) moisture. When I answer “it depends”, I always get the unspoken response, “Why did I ask this stupid idiot?”
Absolute Measurement
When inquiring about the precision of measurements such as weight or temperature, the responses are clear-cut and tied to the accuracy of the instruments. For instance, 25 grams or 50 degrees with a margin of plus or minus (+/-) 0.1 gram or 1/2 degree.
Percent is A Relative Measurement
When questioning the accuracy of your percentage reading, the answer can be quite complex. This complexity arises from the fact that percentage (%) is a relative measurement. Take, for example, the outcome of a Loss on Drying (LOD) moisture test, which is heavily influenced by the size of the sample used.
To better grasp this concept, consider how the result of an LOD moisture test is derived. It involves subtracting the weight of the sample at the end of the test from its initial weight, and then dividing this difference by the original weight of the sample. This calculation ultimately yields a % moisture reading.
Sample Size
The upcoming analysis will shed light on the impact of both sample size and instrument precision. We will delve into a sample containing 23.5% moisture, examined using an electronic LOD moisture balance with a sensitivity of 0.001 grams and a repeatability of +/- 0.005 grams.
Sample Analysis
Read More
Topics:
Moisture Analysis,
Moisture Testing,
CSC Digital Moisture Balance,
Loss-On-Drying,
Moisture,
moisture balance,
instrument accuracy
The ongoing debate between the value of a sieve certification process and sieve calibration has long intrigued me.
Read More
Topics:
Sieve Shakers,
Mid-Point Sieves,
Particle Size Analysis,
Sieve Calibration,
Sieve Testing,
Sieves
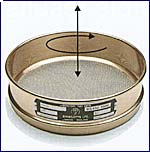
I'm sure many of you have felt the jolt of static electricity when walking on a cozy wool rug in the winter and then reaching for a metal door knob. This same static electricity can cause chaos in your sieving process.
Read More
Topics:
Sieve Blinding,
Agglomeration,
Sieve Testing,
Sieves,
Particle Size Test,
electro static
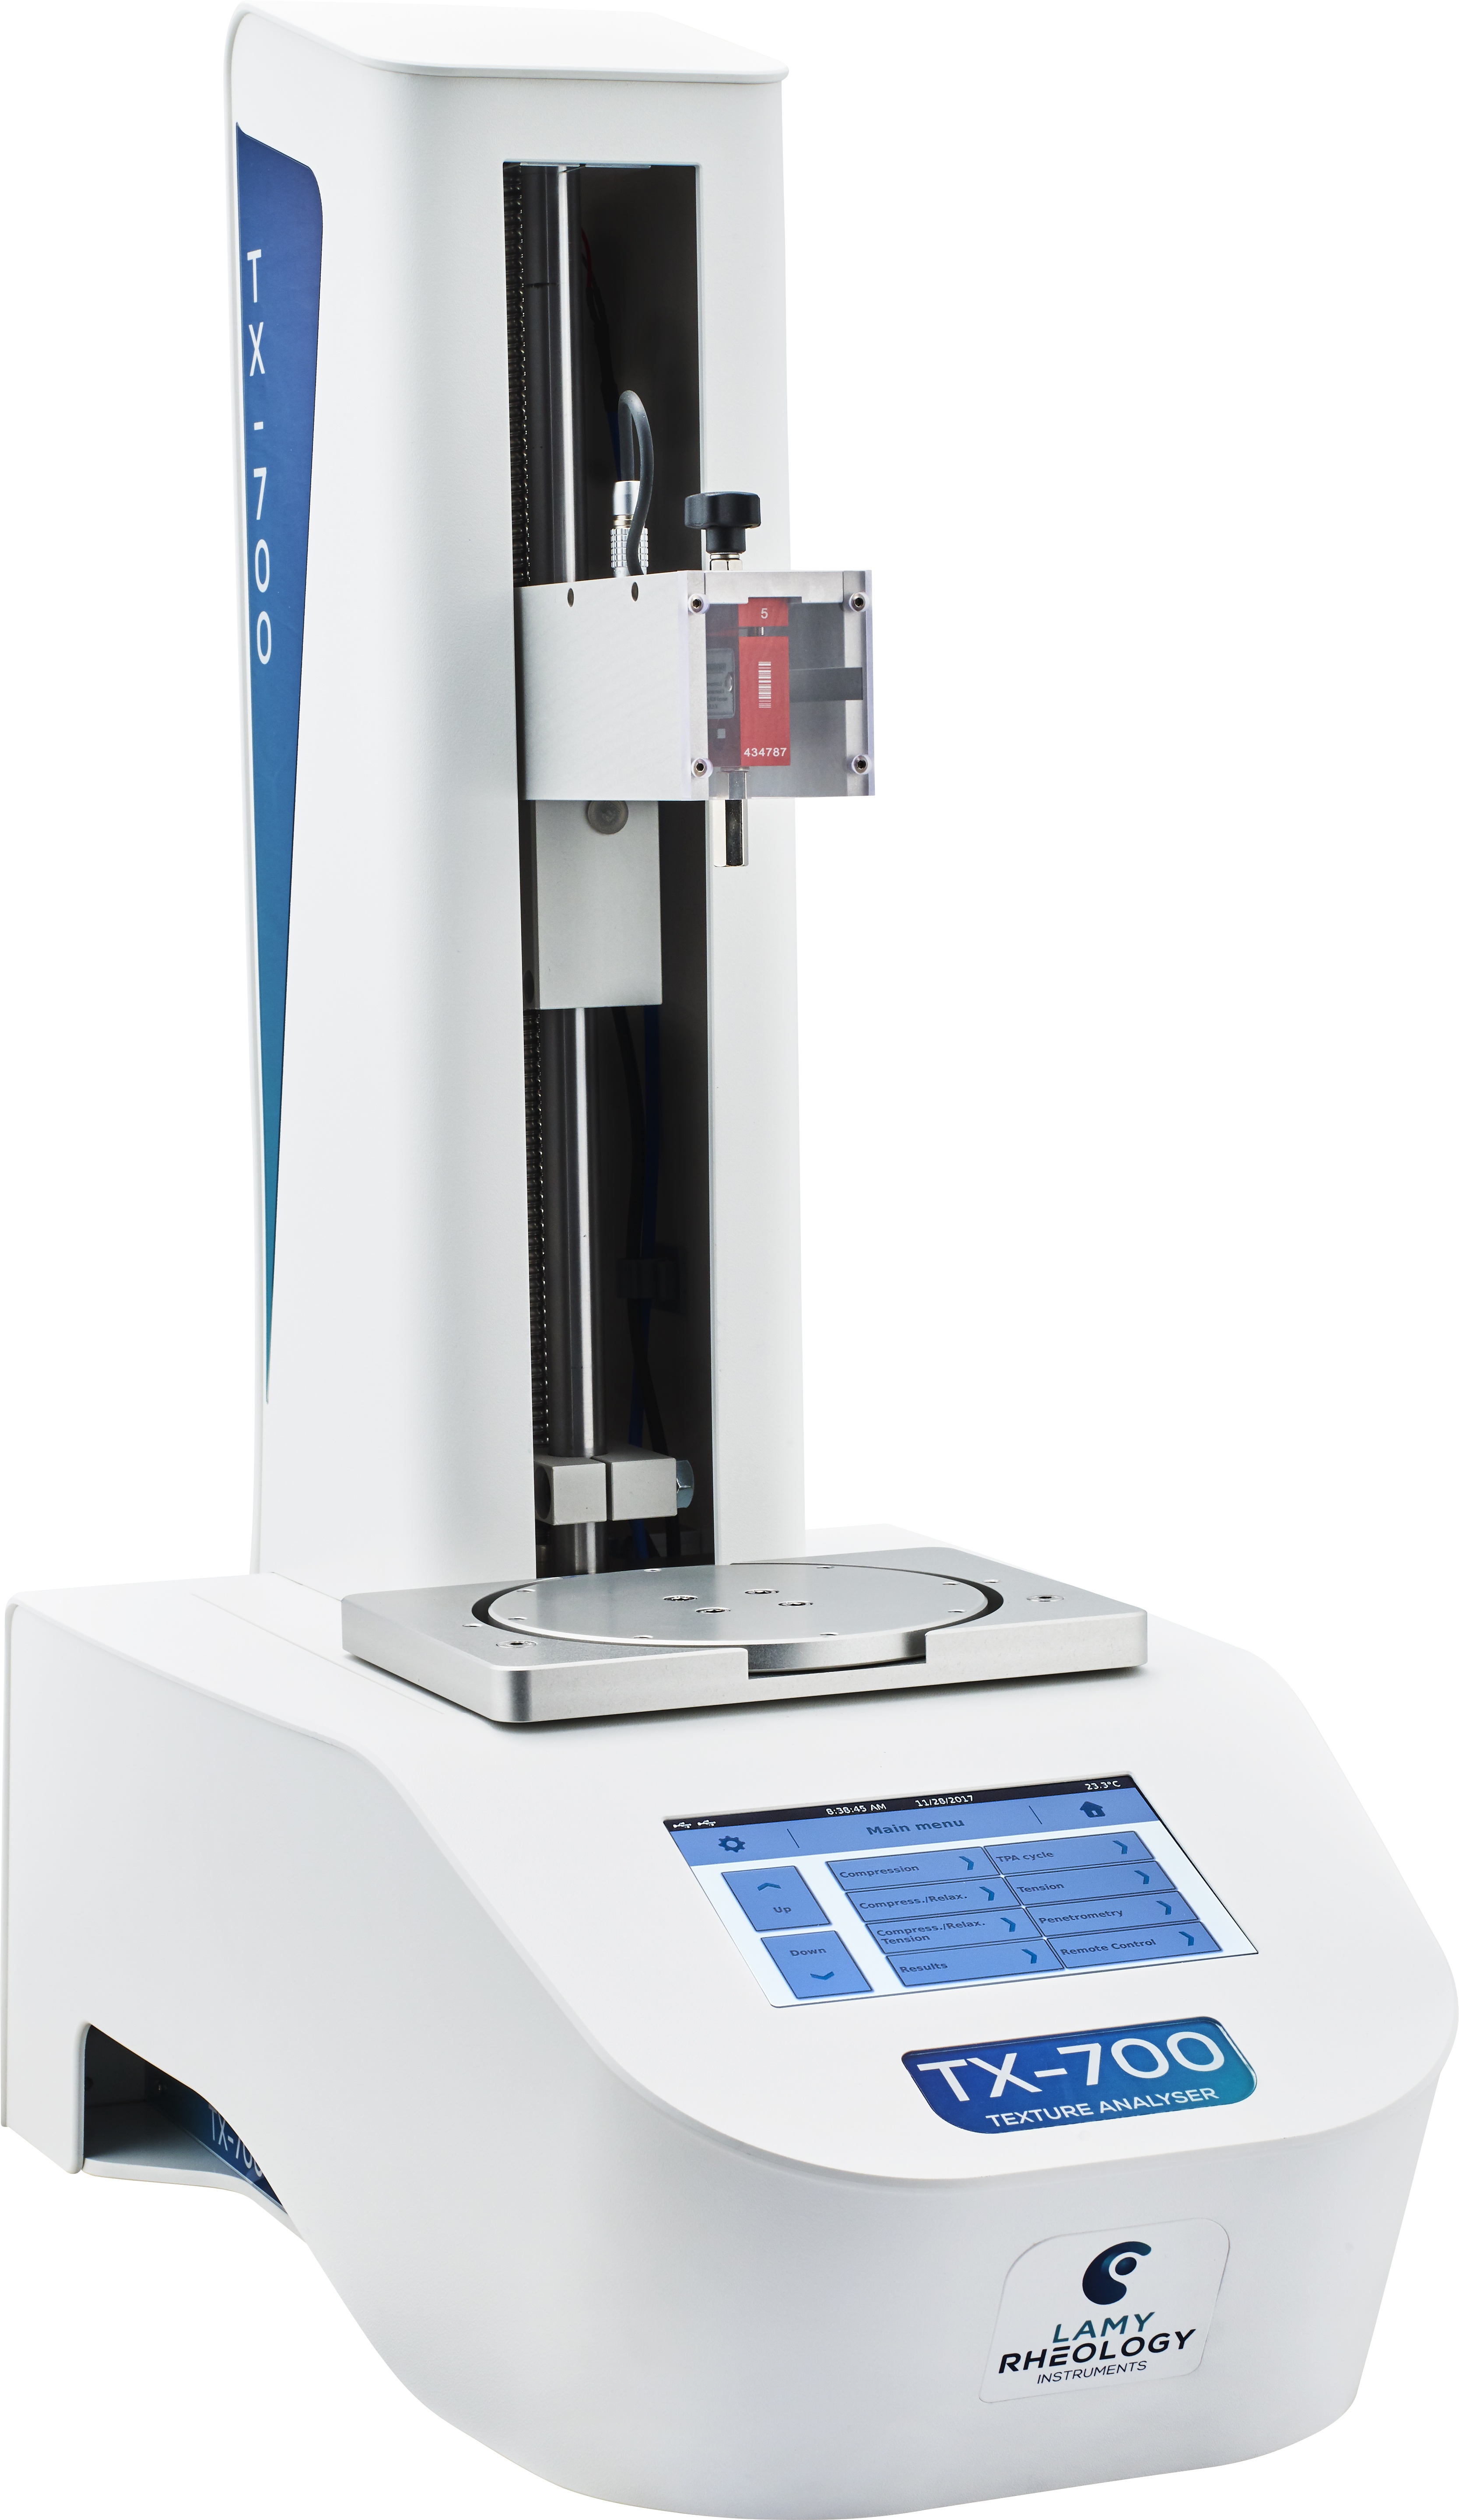
While savoring a delicious meal, the age-old saying "It's all about the taste, not the appearance" often resonates. The visual aspect simply enhances the overall flavor experience. When a dish both looks and tastes exceptional, diners are quick to give it high praise.
Food purchasers and food manufacturers understand that taste isn't the only factor at play. If a food product lacks the right feel or appeal, the initial bite may also be the final one. They require an objective measure of these sensory aspects that is both consistent and reproducible. These sensory aspects fall into a category called texture.
Read More
Topics:
Texture Analysis
Topics:
Sieve Shakers,
"Ask Art",
Sonic Sifter,
Agglomeration,
Particle Size Analysis,
Sieve Testing,
Sieves,
Sieving Process,
Sieve Analysis,
Quiet sieve shakers,
sieve shaker